
Debugging
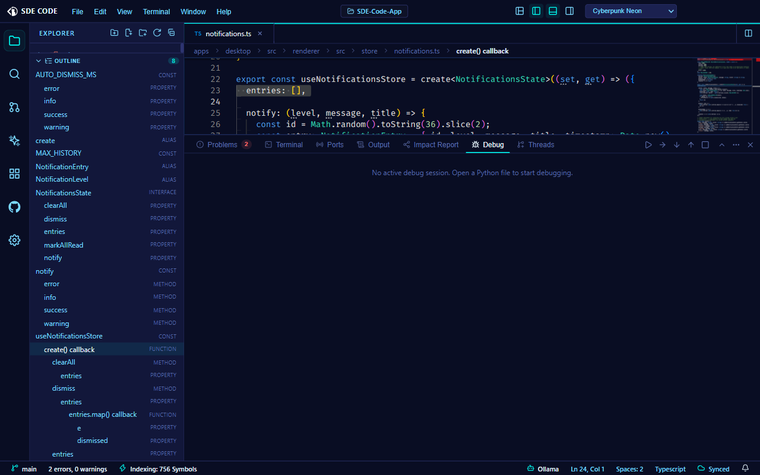
A real Debug Adapter Protocol client
The Debugger is a genuine DAP client — for Python, it drives debugpy, the same debug adapter VS Code itself uses. Extensions can contribute additional debug adapters for other languages via contributes.debugAdapters.
Setting breakpoints
Click in the gutter next to a line number to toggle a breakpoint — a red dot marks it, and the current execution line highlights when paused.
Starting a session
Launch a debug session from the Debug panel. Once paused at a breakpoint, the toolbar gives you:
- Continue — run until the next breakpoint
- Step Over / Step Into / Step Out — standard step controls
- Stop — end the session
Inspecting state
While paused, the Debug panel shows the full call stack and variable scopes for the current frame — expand a stack frame to jump to that point in the code, or expand a variable to explore nested structures.
Debug console
Output from the debuggee, plus any values you evaluate manually, appear in the Debug console alongside the call stack and variables.