
Code Map & Impact Analysis
The Code Map
Opens a force-directed graph of your workspace laid out in three columns — Frontend callers, Modules, and Route Handlers — with animated edges showing which frontend code calls which backend route. It’s built from a real dependency index of the project, not a static diagram.
- Click a node to open its Impact Report (below).
- Double-click a node to open that file directly in the editor.
In a multi-root workspace, the Code Map shows only the primary (first) folder’s graph.
Impact Report (“Analyze Impact”)
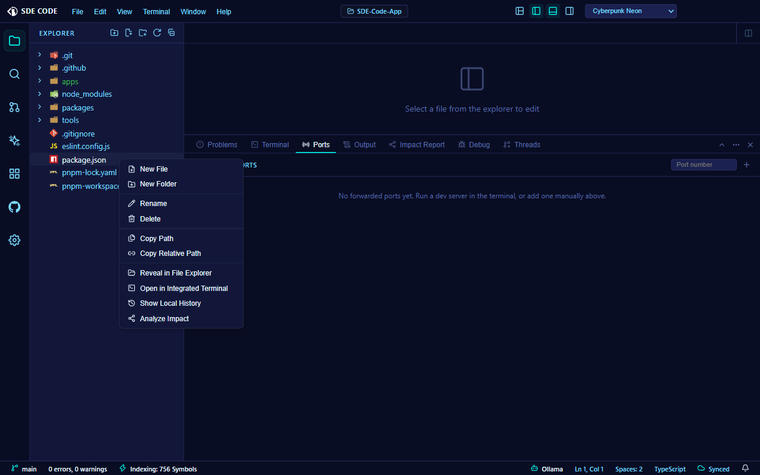
Right-click any file and choose Analyze Impact to see, before you touch anything:
- Directly imports this — every file that imports the one you’re about to change
- Matches this route — for a backend file, which frontend calls hit the API route it defines
- Suggested tests — test files likely to cover this code, with a one-click Run Suggested Tests button that runs them straight from the report
Route/URL matching is regex-based, not a full call-graph analysis — treat the report as a strong starting point, not a guarantee. You can jump from a report back into the Code Map view at any time via View in Code Map.
Impact analysis as an AI tool
The same engine is exposed to Agent Mode as the analyze_code_impact tool, so the AI can check a file’s blast radius itself before proposing an edit — reasoning about what else might break, not just what you asked it to change. See AI Assistant & Agent Mode for the rest of the AI tool surface.